
Florida Map Gallery
Maps of the State of Florida
Coronavirus
Geographic Distribution of the Coronavirus in Florida
Many factors will dictate the geographic distribution of coronavirus cases in the
state of Florida.
However, the demand for testing kits, need for professional medical care, and number
of fatalities will likely be most influenced by the number of seniors (persons aged
65+). Based on Census Bureau Estimates, Florida had more than 4.3 million senior residents
in 2018.That number illustrates the importance of minimizing the spread of infections.
If only 1 in 100 Florida seniors were to be infected, and a mortality rate of 2% were
to be applied, that would result in over 850 deaths statewide (4,366,361 * .01 * .02
= 873). Higher infection and mortality rates would obviously result in more fatalities.
Geographic Distribution of the COVID-19 Confirmed Infection Rate in Florida April, 2020
These percentages were calculated using the number of confirmed COVID-19 Cases per
county from the Florida Department of Health on April 24, 2020 (10:00am) and the 2019
Population Estimates from the US Census Bureau.
The confirmed infection rate per 10,000 for Florida is 14.0 (30,174 total confirmed
cases / 21,477,737 population estimate = 0.001404 x 10,000 = 14.04). The confirmed
infection rate for other large states by comparison:
| *New York | 130.1 |
| California | 9.0 |
| Georgia | 19.6 |
| Texas | 7.3 |
Many factors will dictate the geographic distribution of the confirmed infection rate.
Testing is most common among individuals that feel sick. These relatively low confirmed
infection rates demonstrate the clear need for more testing to quantify persons who
have COVID-19 and are asymptomatic, have mild symptoms, or are presymptomatic. Additionally,
it is necessary to identify those persons who have already had COVID-19 but were not
tested. The prevalence and effectiveness of social distancing also plays a role in
preventing the spread of the virus.
Counties like Suwanee or Madison appear to have higher rates because they are regional
health centers, and a positive case may be reported at county of testing rather than
county of residence.
Geographic Distribution of the COVID-19 Confirmed Infection Rate in Florida May 2020
These percentages were calculated using the number of confirmed COVID-19 Cases per
county from the Florida Department of Health on May 11, 2020 (8:00am) and the 2019
Population Estimates from the US Census Bureau.
The confirmed infection rate per 10,000 for Florida is 18.4 (39,514 total confirmed
cases / 21,477,737 population estimate = 0.001839 x 10,000 = 18.4). The confirmed
infection rate for other large states by comparison:
| New York | 168.9 |
| California | 16.3 |
| Georgia | 30.7 |
| Texas | 13.1 |
Increases in the rate of infected persons during the past 2 weeks were most noticeable
in Florida’s rural counties. Liberty County, Florida’s smallest in terms of population
with less than 8,500 persons, reported 175 new cases since May 1, nearly all attributed
to inmates and some employees at the Liberty Correctional Institution.
In addition, the rate of infected persons has more the doubled over the past two weeks
in Calhoun, Columbia, Hardee, and Jackson counties. Infection rates in large urban
counties grew at a rate similar to the state as a whole.
Geographic Distribution of the Percent of Florida’s Population Tested for COVID-19
The percentage of persons tested for the State of Florida increased from 1.88% to 2.83% during the past 2 weeks (May 1 - 15). Many counties in the Central Panhandle have doubled their testing rates. Liberty County, with the highest infection rate in the state, now also has the highest testing rate. Miami-Dade and Duval continue to have the highest testing rates among Florida’s large population counties. Many factors will dictate the geographic distribution of the percent of Florida’s population tested for COVID-19. These include the desire/recommendation to be tested, access to testing sites, the availability of tests, and the response to outbreaks.These percentages were calculated using the number of persons tested per county from the Florida Department of Health, May 15, 2020 (11:30am) and the 2019 Population Estimates from the US Census Bureau.
Geographic Distributions of Primary Care Facilities in Florida
This map illustrates the distribution of Primary Care Physicians in Florida. This includes those physicians classified as family doctors, general doctors and internists (internal medicine). According to US Med Data, there 18,226 of these physicians in Florida as of March 2020. The total population estimate for Florida counties for 2018 was 21,299,328. That results in a primary care physician to population ratio of 1:1,169. That is 1 primary care physician for every 1,169 residents. Primary care physicians represent the front line of defense against COVID-19. If an individual thinks they are exhibiting symptoms, the first course of action is to contact their primary care physician. Diagnosis and recommendations regarding testing and home treatment vs. hospitalization are generally made by a primary care physician. Persons will travel across county boundaries for health care, so counties with better ratios like Alachua or Duval may pull in residents from surrounding counties. However, some counties with poorer ratios that cluster together like Hamilton, Suwannee, and Lafayette, or Highlands, Glades, and Hendry constitute underserved areas or health care deserts that need to be addressed.
Geography of Nursing Homes in Florida May 2020
A nursing home provides nursing, personal, custodial, and rehabilitative care. Nursing
homes, are freestanding, which means they are not part of a hospital. Nursing homes
are licensed and surveyed by the State of Florida.
The CDC states “Given their congregate nature and resident population served (older
adults often with underlying chronic medical conditions), nursing home populations
are at the highest risk of being affected by COVID-19. If infected, residents are
at increased risk of serious illness.” This map of the geography of nursing homes
brings to mind mid-twentieth century Florida with retirees flocking to St. Petersburg,
Palm Beach, and Miami. 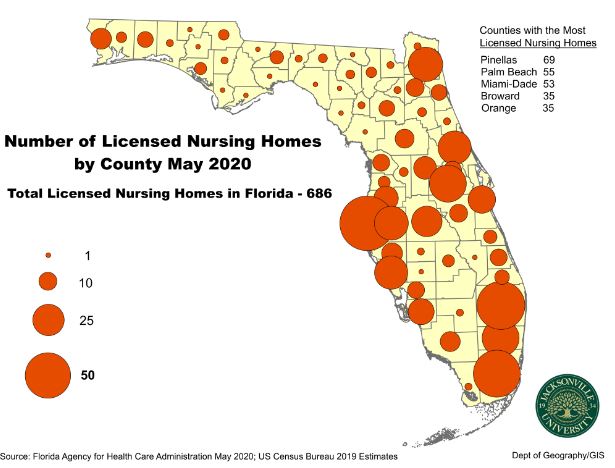
Crime
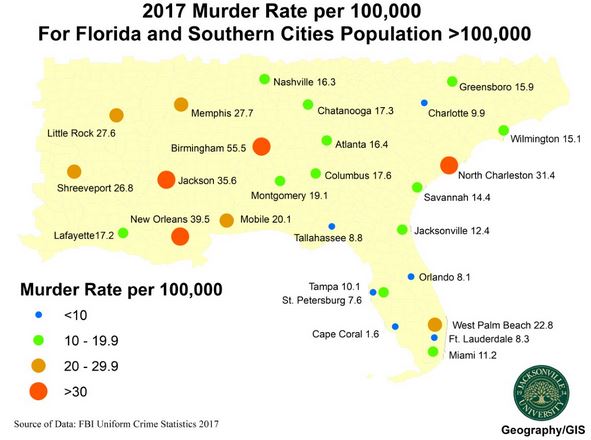
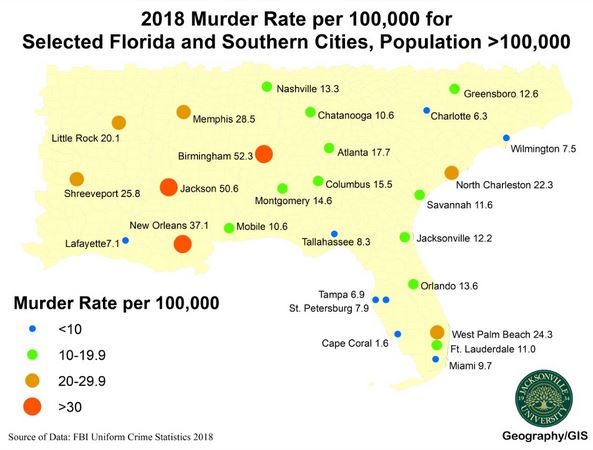
Murder Rate
These murder rates were obtained from the 2017 and 2018 FBI Uniform Crime Report for selected municipalities with populations greater than 100,000. Although patterns do not persist, muder rates are subject to great variabilitiy when examined through time and space. For example, the murder rate in Layfayette, Louisianna decreases by half from 2017 to 2018. Likewise, the murder rate for Fort Lauderdale, Florida is half that of nearby West Palm Beach. Perceptions about murder rates can often be misleading. Jacksonville, Florida is sometimes characterized as a city with a high murder rate. However, some other Florida cities have higher murder rates, and in comparison to other cities in the Southeast, Jacksonville's murder rate is relatively low.
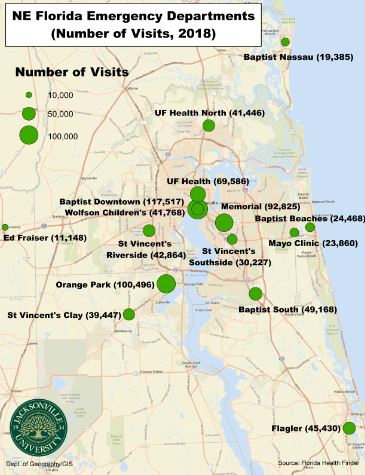
Northeast Florida
Health
This map illustrates the locations of Metro-Jacksonville hospital emergency departments and their relative workloads based on the most recent data available 2018). Baptist Downtown averaged more than 2,200 visits per week. Orange Park Medical Center was nearly 2,000 visits per week.
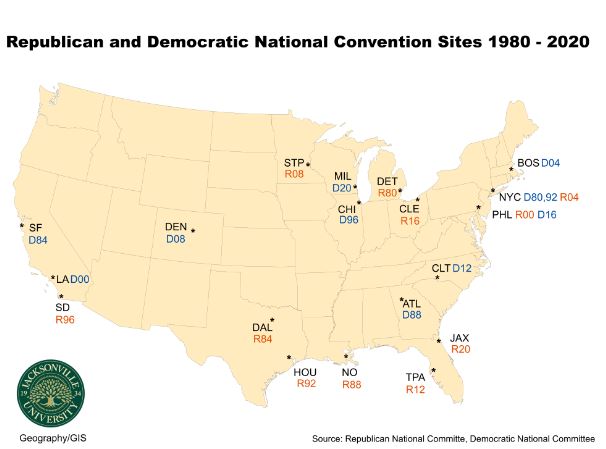
Politics
Jacksonville is the smallest metropolitan area (population) to host a Republican or Democratic National Convention since Atlantic City hosted the Democrats in 1964. Similar to hosting the Super Bowl, is Jacksonville punching above our weight? Or were no bigger cities interested in hosting the convention?
Sustainability, Geography, and Environmental Planning
Related Links
Contact
Sustainability, Geography, and Environmental Planning
Sustainability, Geography, and Environmental Planning
Jacksonville University
Gooding Building
2800 University Blvd N
Jacksonville, FL 32211
(904) 256-7669