What’s in a map? You might immediately recall the route you took to the new restaurant you tried the other day—gingerly following the bubbly blue lines and pushy white arrows on your phone and reply, “Directions, of course!” Certainly, charting designations and the many routes to them is one of the main functions of maps. But what else?
If you ask the map-makers at Jacksonville University, they’ll tell you it’s much more than that. Maps communicate policy issues and histories of cultures around the globe, they express warming and cooling temperatures, population densities, zip codes where resources are allocated, food deserts, stray animals, and so much more. For this reason, it is critical that maps are legible, expressive, and clear.
Made possible through an EPIC grant from the Florida Department of Education and in collaboration between the Sustainability, Geography, and Environmental Planning, and Visual Arts departments, the Beautiful Maps student art gallery showcases the work of students who explored the artistic principles of line, shape, color, and contrast to create maps that are both accurate and beautiful. The gallery opened in early April.
“From geo-political markers to population densities to the Starbucks nearest you: it's certainly important that maps are accurate. But accurate data isn't enough to communicate the information that's so essential to understanding our globe, our neighborhood, and everything in between,” said Prof. Nicholas McNally.
The project, titled "Integrating Aesthetics and Accuracy: combining the principles of Illustration and Geography to make beautiful maps accurate and accurate maps beautiful," was led by Drs. Ashley Johnson, Ray Oldakowski, and Professor Nicholas McNally. The idea first came from Dr. Johnson after one of her students expressed challenges interpreting data in his mapping class due to colorblindness.
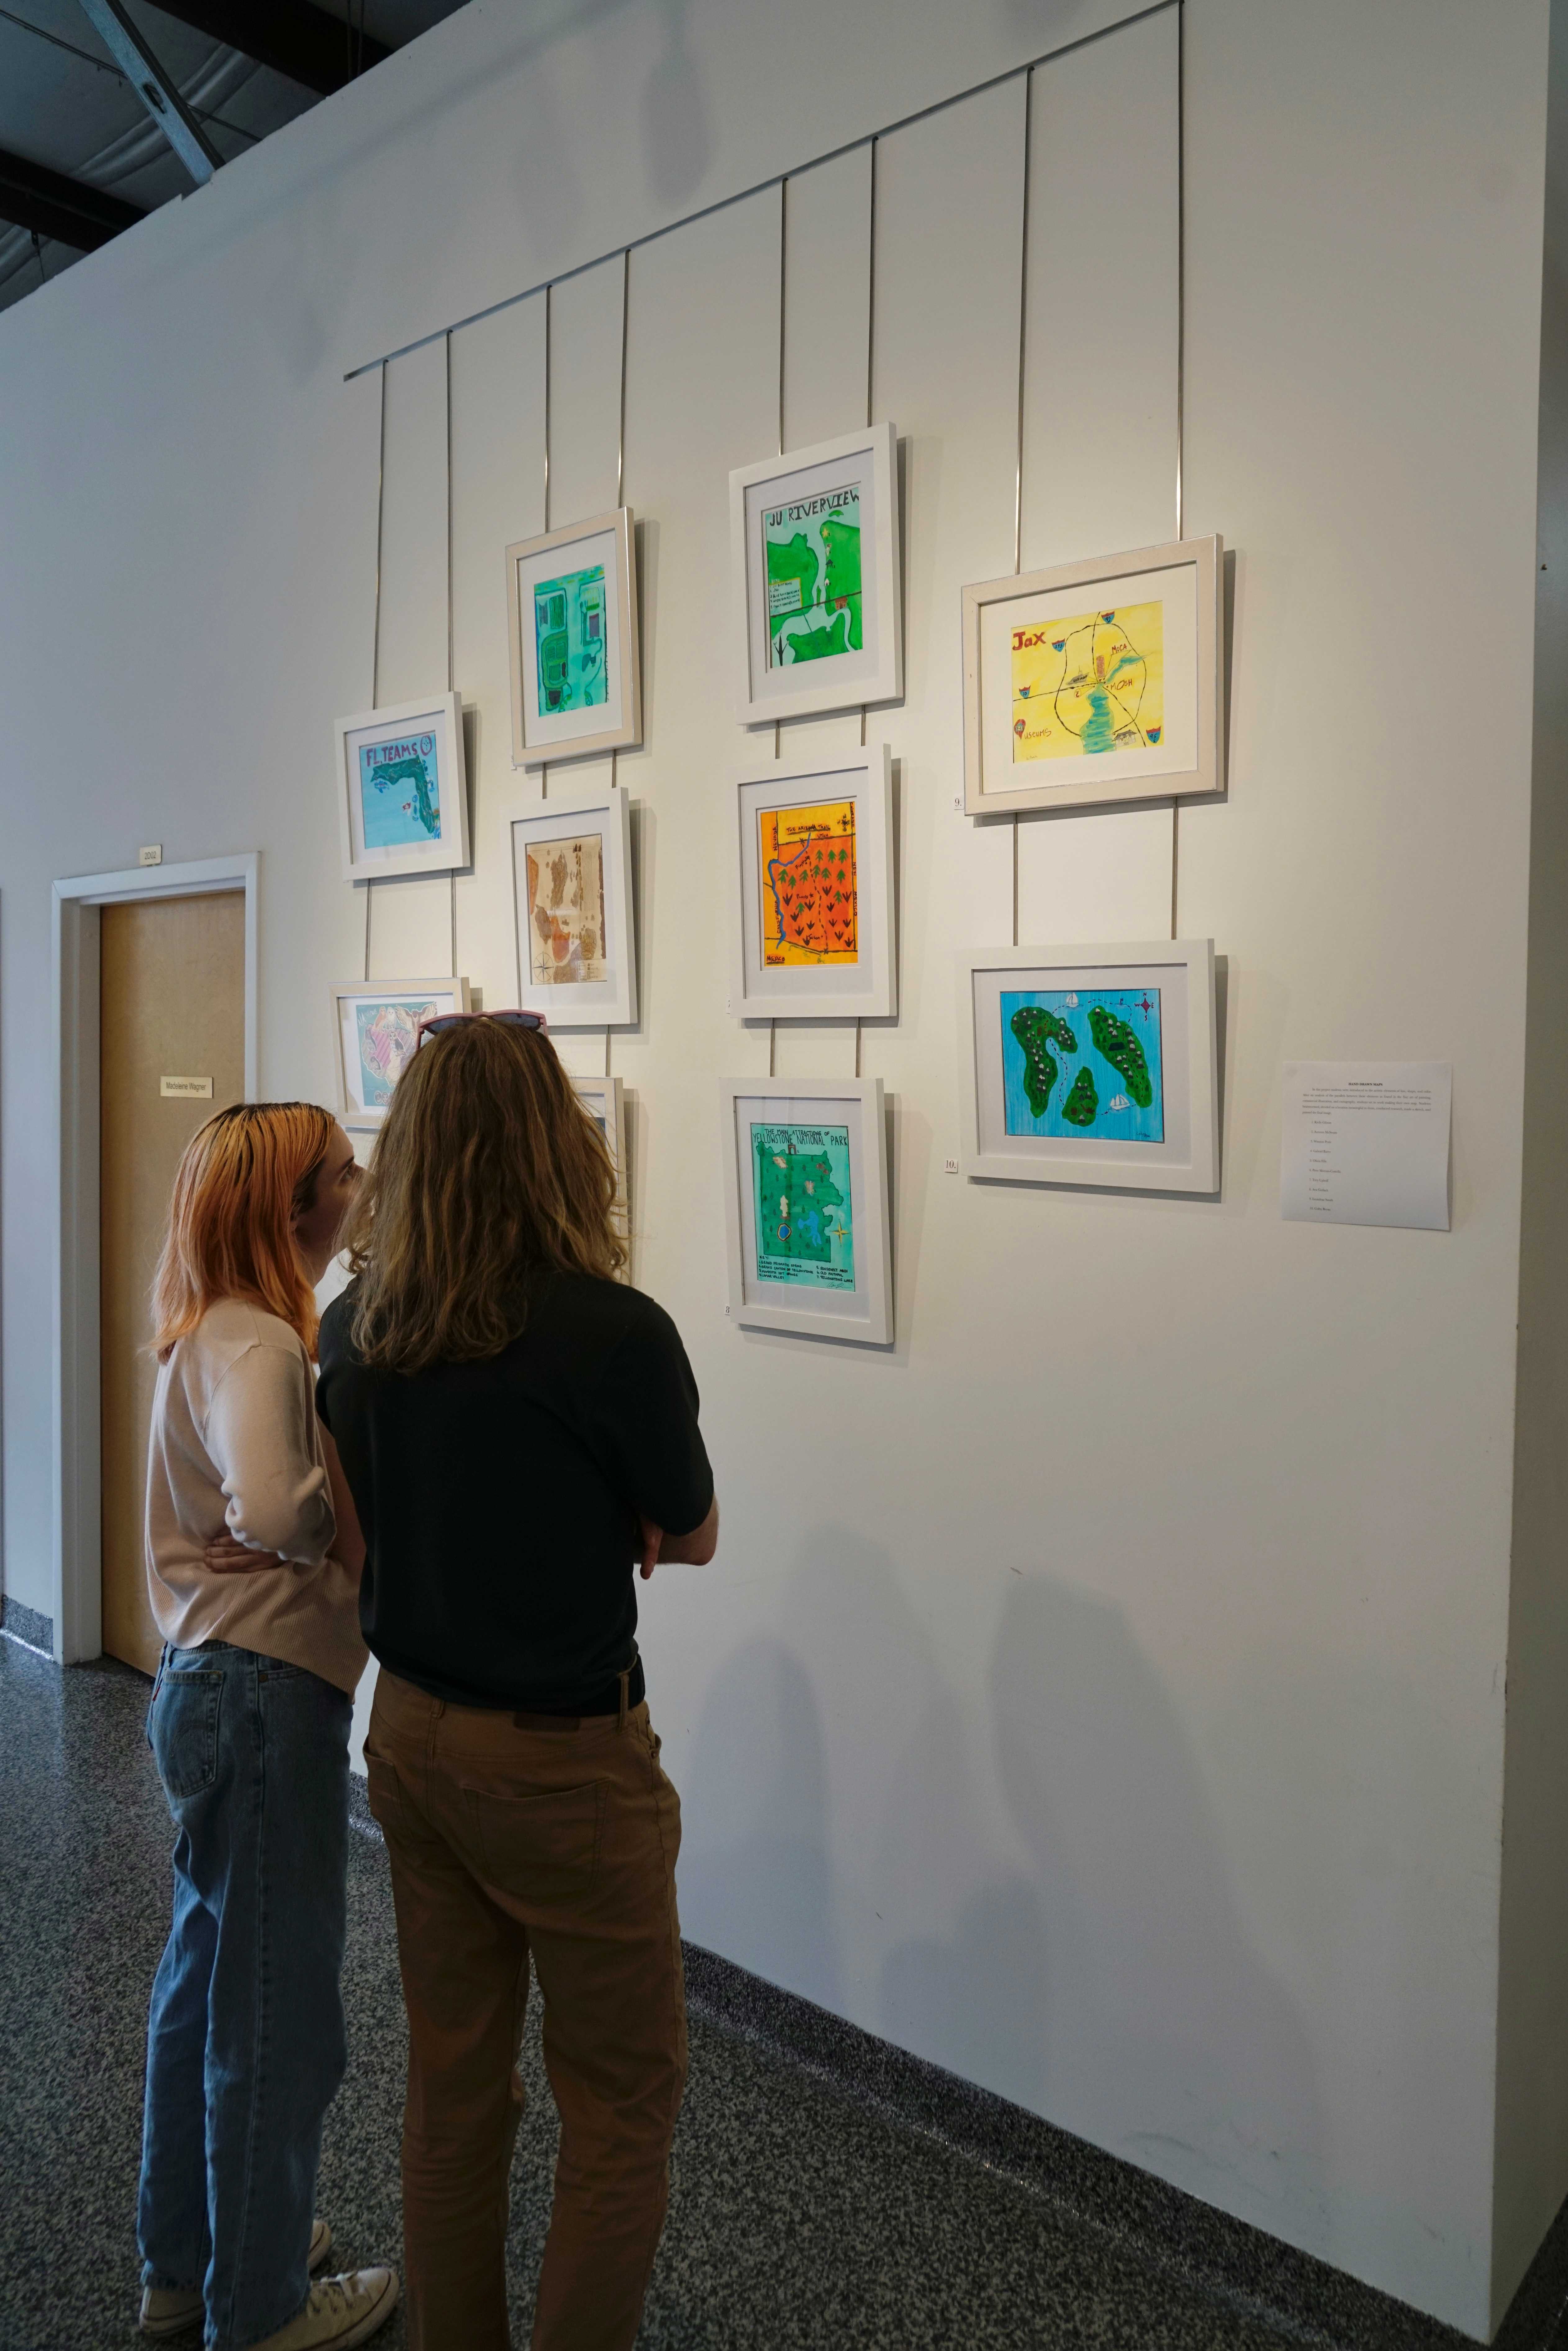
“The artistic principles of line, shape, color, and contrast are essential for ordering those data so that we can read the maps before us. And those principles need not be only utilitarian. We can use them to make accurate maps beautiful: works of art that are both informative and a delight to behold. In this course, students worked with data, narrative, symbology, and all of the principles of visual design to make this happen,” said McNally.
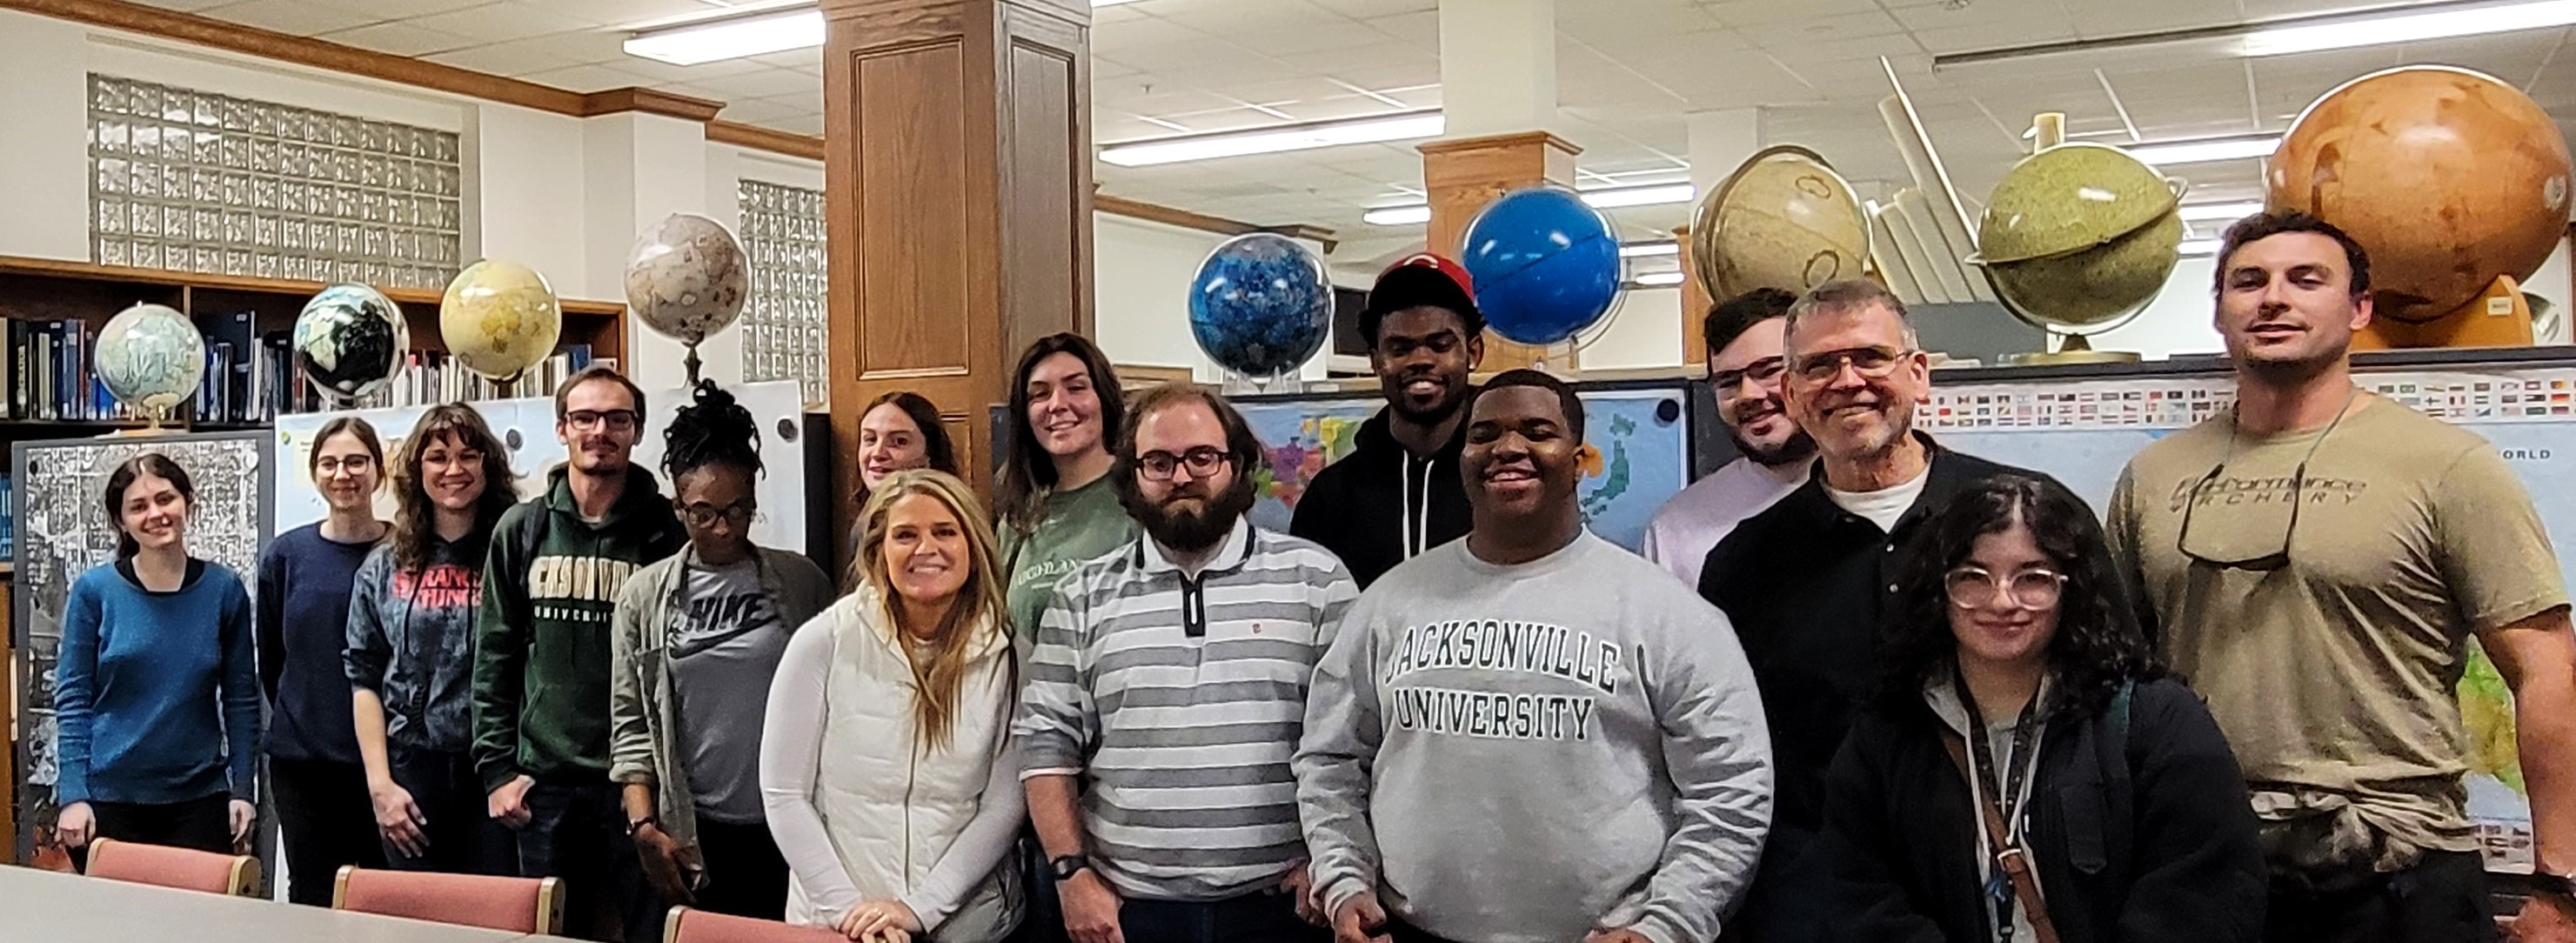
Thus, the Creative Maps course was created and spatial analysis principles were integrated into an existing visual arts course, Illustration Studio 1. Students from both courses worked on a creative map project together.
The structure of the project involved each professor instructing both illustration and geography students on cartography; the art and science of making maps. Two collaborative and integrated classes ran simultaneously allowing for a blended classroom experience for the students. Each professor taught a 4-week block of curriculum related to their expertise. The geography and sustainability students, trained in ArcGIS, and the illustration students trained in Adobe and design software exchanged knowledge about the computer programs often used in their respective fields. Together the students created online story maps akin to virtual field trips, hand-drawn and GIS-generated thematic maps, drone images and videos, and personalized photo maps which blend images of the student with a map of their favorite location. Some projects included mapping the population densities of bears in Florida, the annual number of panthers killed by motor vehicles and where it happens most frequently in the state, and other environment-related research.
The courses culminated in an art exhibit highlighting the imaginative work done by both groups of students. The exhibition served as a showcase for students, faculty, parents, community members, and potential employers of both visual arts students and GIS students and will remain in the 2D Art Gallery until next semester.
"It has been incredible watching the students learn from each other as well as from the faculty. Whenever possible, we have teamed the geography students with the illustration students to complete their projects. It is exactly the type of collaboration across disciplines that we were hoping for when we designed the course,” said Oldakowski.